Patronage for individual bus services
The raw data contains detailed information for every time an agent boards or alights from a bus, therefore it is possible to aggregate the data in different ways including how many passengers travel on each individual bus.
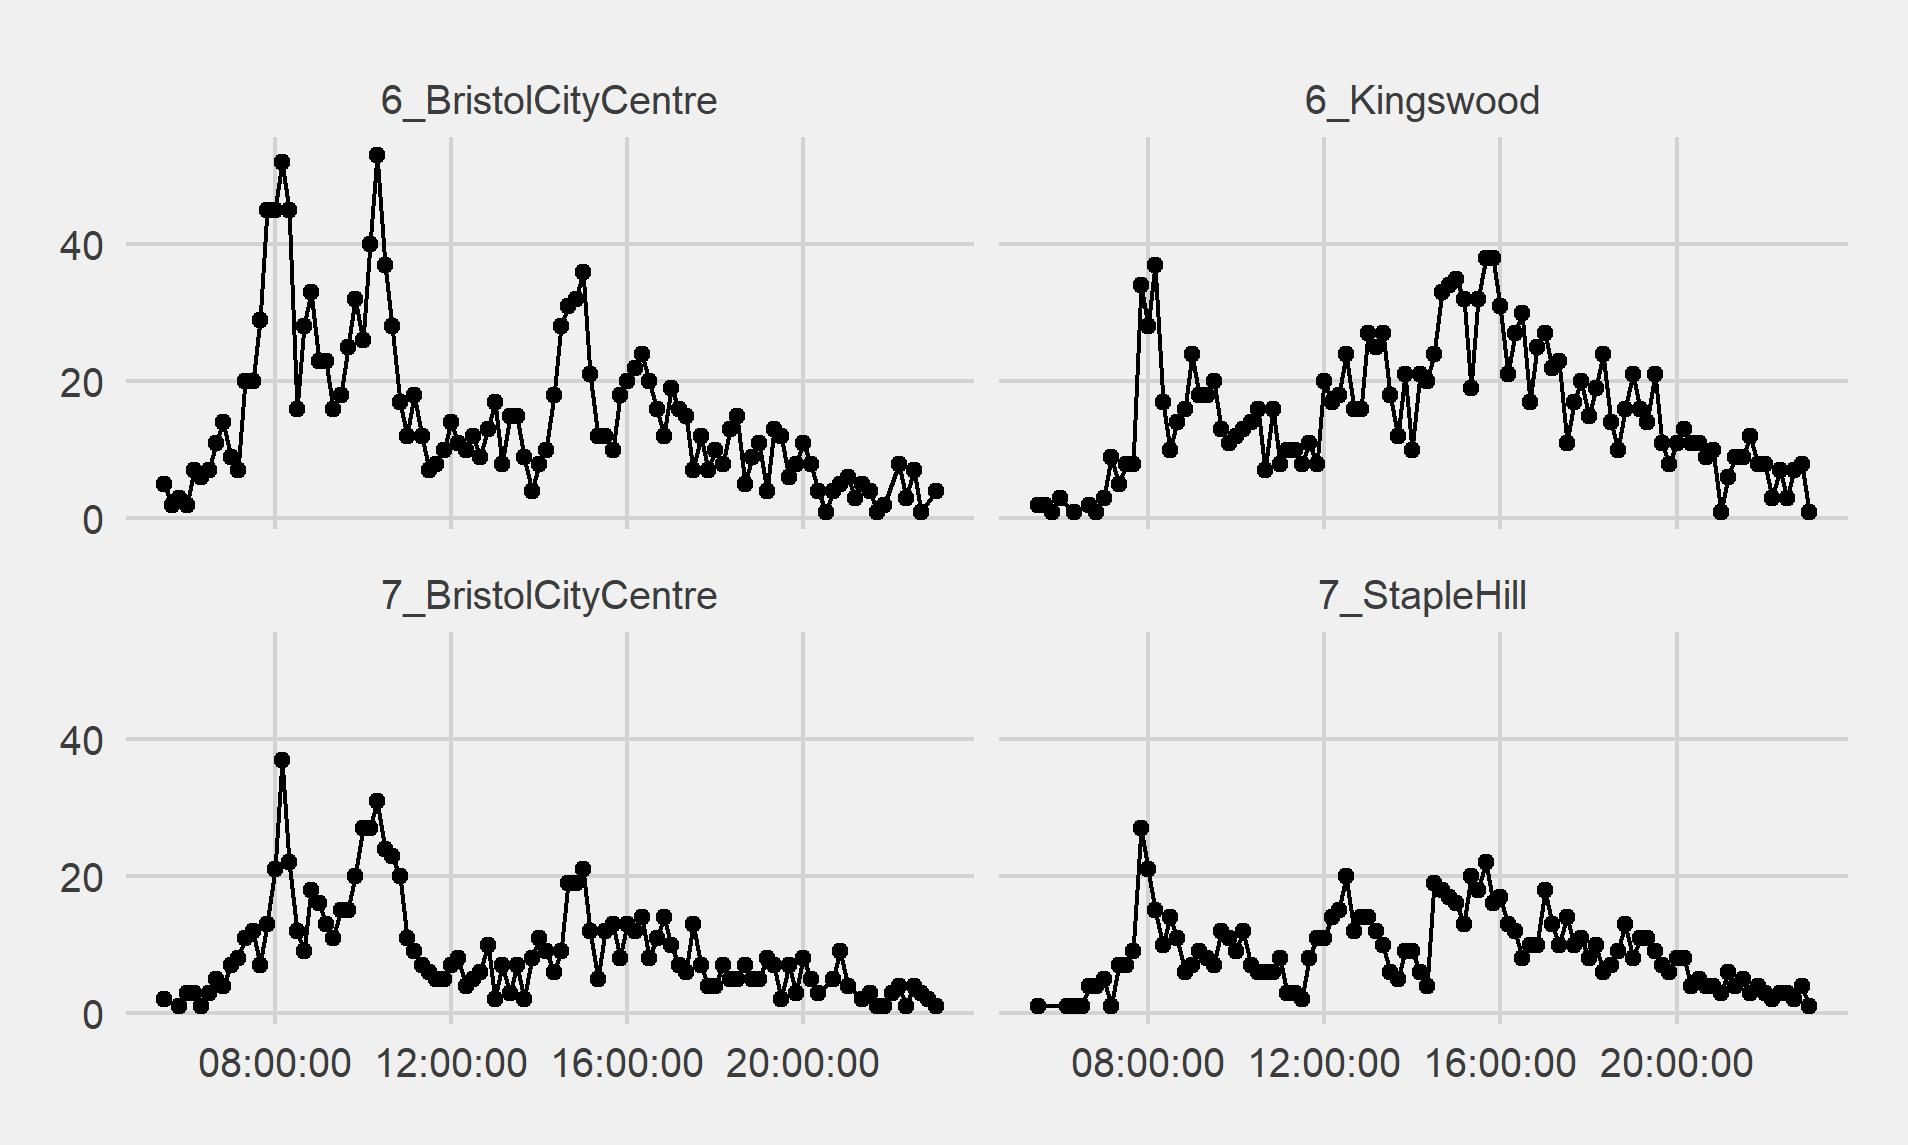
This plot shows the total number of passengers for each bus. The bus services heading towards the City Centre have more pronounced peaks in patronage during the morning period.
Stop by stop boarding totals
The output data also contains information about where each agent accesses a public transport service.
For the 6 and 7 bus routes the most popular stop for accessing these services is 'The Centre'.
Does patronage increase with a more comprehensive bus service?
Using the outputs from the three scenarios that we have modelled, we can test the hypothesis that patronage will increase if we increase the service frequency on the two bus routes. More buses should mean more passengers.
Our data does show an increase in patronage when bus services are more frequent. The largest total increase was on the 6 route to the City Centre, where almost 300 extra passengers are forecast when the service frequency is increased from every 30 minutes to every 10 minutes.
Mode Shift
We can also compare the data from the scenarios across all modes of transport to ascertain which mode(s) account for the increase in public transport usage.
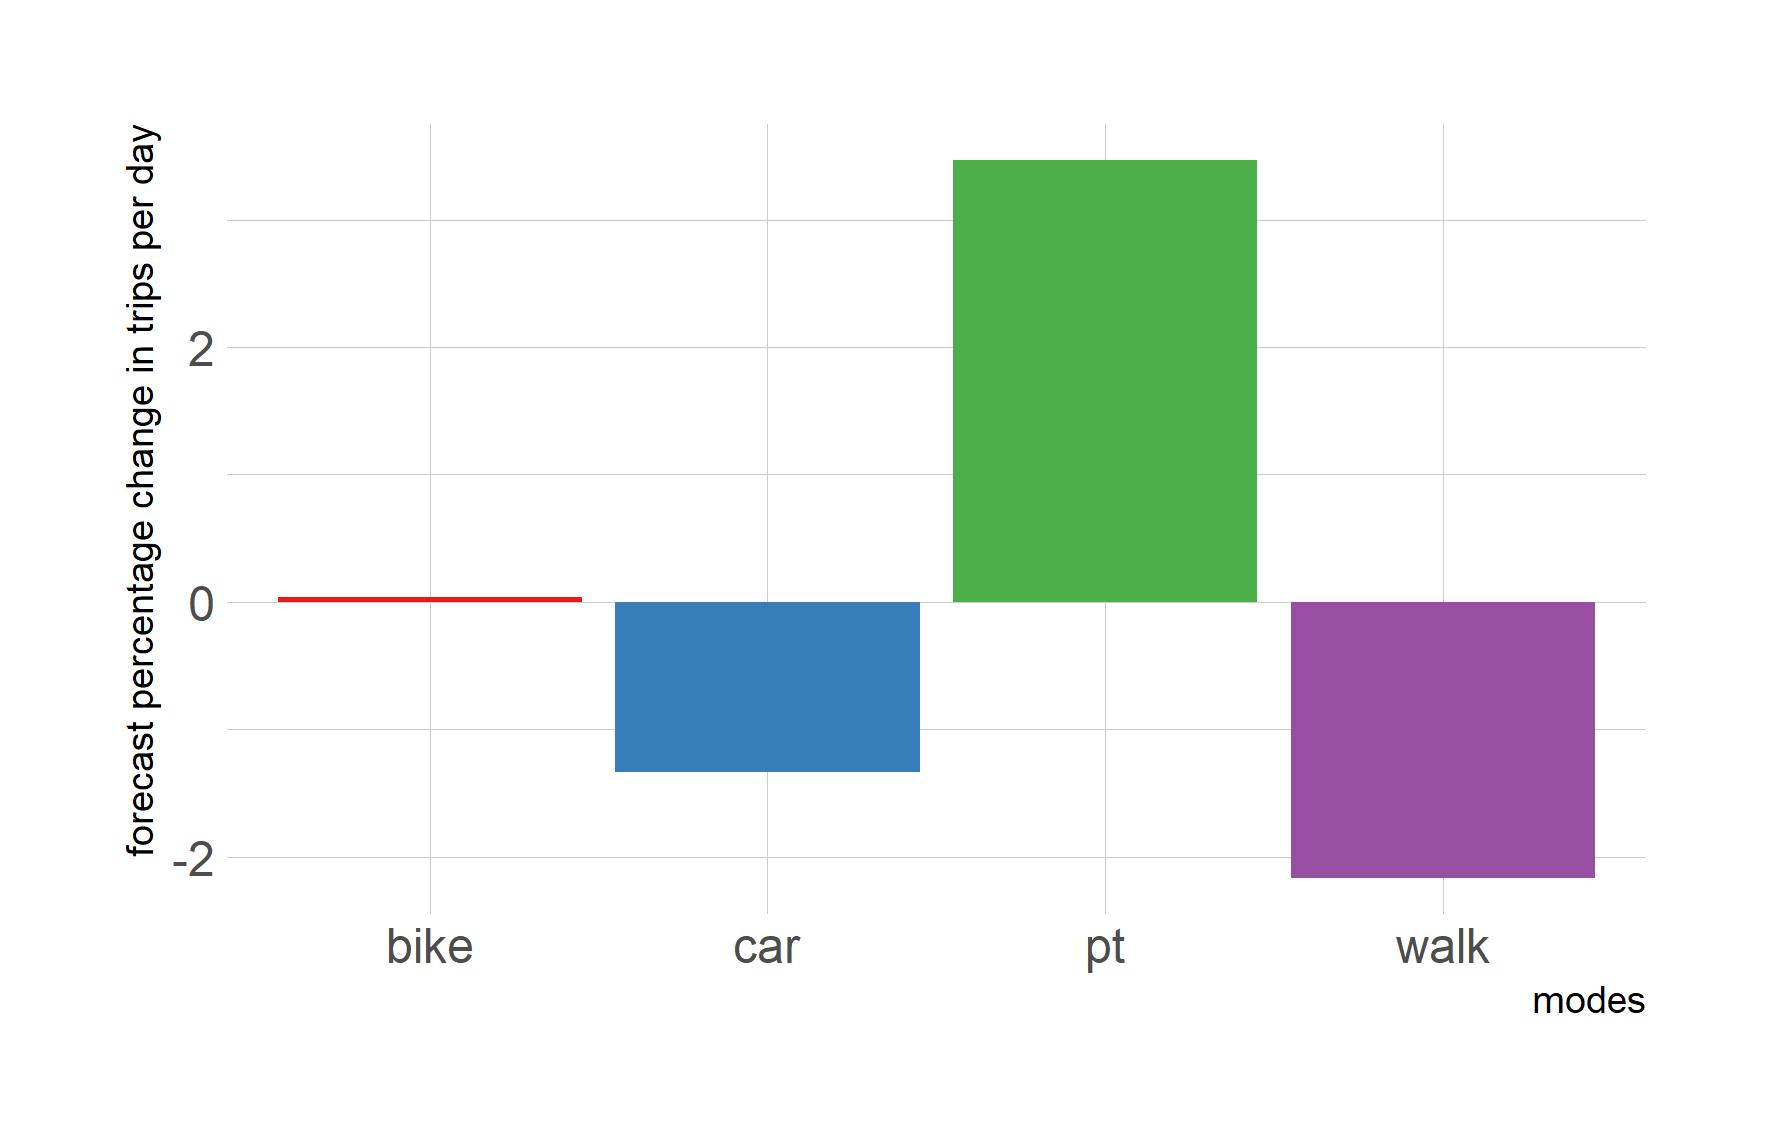
Inreasing bus service frequency is forecast to increase bus patronage by over 3%, and decrease the number of walking and car trips. The number of bike trips stays almost the same. With further analysis it is possible to create a more detailed view of which modes account for the increase in public transport usage.